Ozone Disinfection

Water is a disinfected but never completely sterilized in the water treatment process. This disinfection is a two-part process that includes:
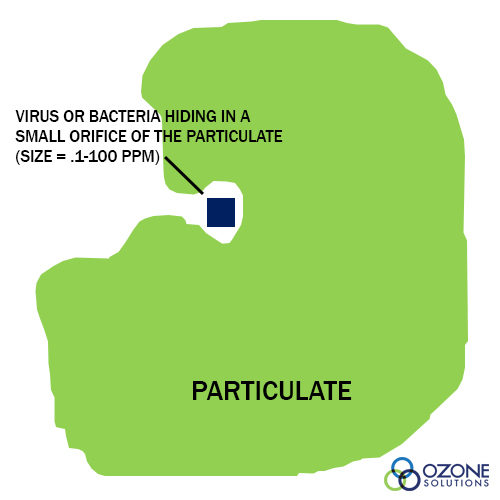
- Removal of particulate matter by filtration. A rule of thumb is that high turbidity in the effluent is a potential health risk because viruses and bacteria can hide within the rough texture of particulates. Therefore, removal of the particulates reduces the chance of pathogenic microorganisms in the effluent. (see Particulate figure)
- inactivation of pathogenic microorganisms by chlorine, chlorine dioxide, ozone or other disinfectants: Contact time and kinetics are simply a measure of the inactivation due to time and concentration of the disinfectant. The USEPA has developed regulations for the minimum kill percentages (inactivation) necessary for public water to be considered potable. These regulations include a minimum disinfection of:
- Three Log (99.9%) for Giardia Lamblia Cysts
- Four Log (99.99%) for Enteric Viruses
In "water treatment terms," 1 log inactivation is referred to as 1 credit inactivation. Different types of filtration are assigned certain removal credits. For example, conventional filtration is worth 2.5 credits for Giardia cysts. Since the EPA requires 3 log (credit) removal, an additional 0.5 credit inactivation from disinfection must be attained.

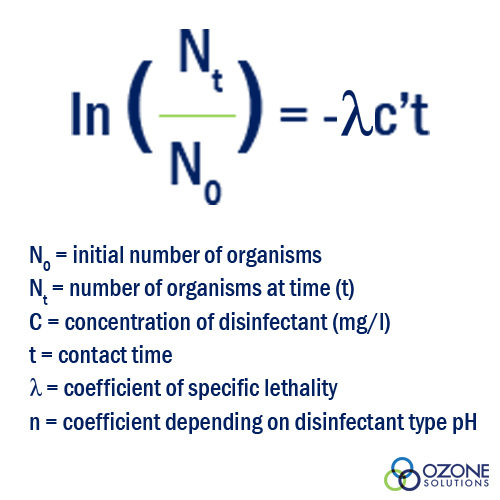
Varying degrees of disinfection can be attained by altering the type and concentration of disinfectant, as well as the time water is in contact with the disinfectant. The decision to use one type of disinfectant versus another will set the precedence for the remainder of the values needed to attain the proper disinfection. The time untreated water is exposed to the disinfectant and the concentration of that disinfectant are the main factors in the equation that will be discussed in the next section [Notice that the units of contact time are (mg/l)(min)].
Relationship Between Kill Efficiency and Contact Time
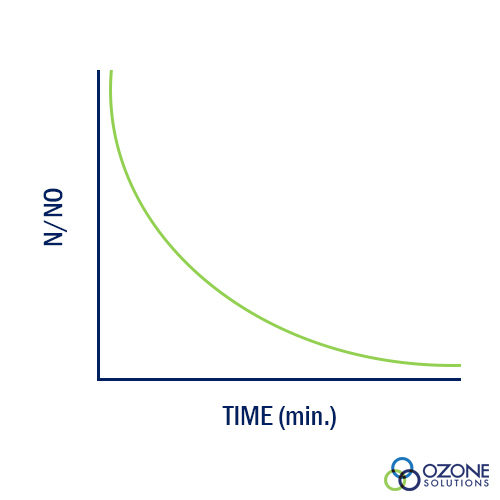
A relationship between kill efficiency and contact time was developed by Harriet Chick while she was a Fellow in the Pasteur Institute in Paris, France. The research yielded data supporting her relationship that is shown in the graph. 'No' represents the initial number of organisms and 'N' is the number or organisms at 'Time.' As contact time between water and disinfectant increases, the ration of N/No decreases as Chick's Law predicts.
Factors Affecting C*t Values
-
As pH increases, the value of C*t also needs to be increased. This can be explained by examining the effects of pH on free chlorine. As the pH increases, more of the weak disinfectant (OCI-) exists than the strong disinfectant (HOCI-), thus increasing the C*t value. Refer to the Table 1 below.
- The greater log removal needed, the greater the C*t needs to be, as can be seen in the table below.
| LOG REMOVAL | pH <6 | pH 6.5 | pH 7.0 | pH 7.5 |
|---|---|---|---|---|
| 1.0 | 46 | 54 | 65 | 79 |
| 1.5 | 69 | 82 | 98 | 119 |
| 2.0 | 91 | 109 | 130 | 158 |
| 2.5 | 114 | 136 | 163 | 198 |
Information from the Virginia Department of Health Waterworks Regulations
- The strength of a disinfectant directly affects the C*t. For a weak disinfectant, the C*t will have to be higher than for a strong disinfectant. As Table 2 below shows, ozone is the strongest disinfectant, thus the C*t value required is less when compared to chlorine and chlorine dioxide.
- Different organisms have different resistances to disinfectants. If an organism has a strong resistance to a certain disinfectant, the C*t will be higher than for an organism with a weaker resistance. Refer to Table 2 below.
Table 2: C*t Values for the 99% Inactivation at 5° C of Organisms Using Various Disinfectants
| ORGANISM | FREE CHLORINE (pH 6-7) | CHLORINE DIOXIDE (pH 6-7) | OZONE (pH 6-7) |
|---|---|---|---|
| E. Coli | 0.034-0.05 | 0.4-0.75 | 0.02 |
| Rotavirus | 0.01-0.05 | 0.2-2.1 | 0.006-0.06 |
| Giardia Lamblia Cysts | 47-150 | - | 0.5-0.6 |
| Crystosporidium Parvum | 7200* | 79* | 5-10* |
*99% inactivation at 25°C
Hoff, J.C., Inactivation of Microbial Agents by Chemical Disinfectants, EPA/600/2-86/067, 1986
