
Ozone Levels
The chart below shows various information regarding a range of ozone concentration levels.
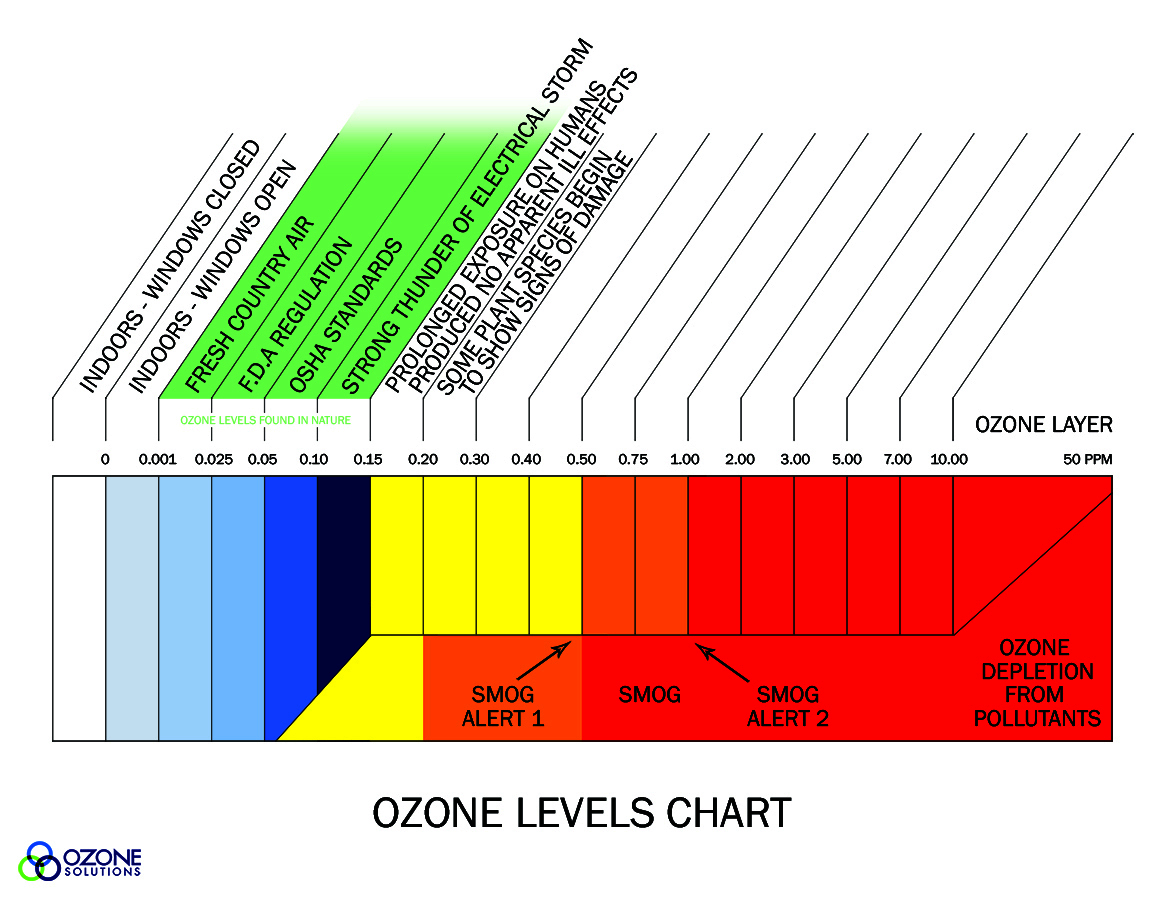
Reading the Chart
As can be seen, a standard building has very little if any ozone in it typically, regardless of the windows being open or closed. A standard day in the country has about 0.001 - 0.025 ppm of ozone in the air. This rises slowly depending on many factors including temperature and humidity. A strong thunderstorm is generally going to produce enough ozone to raise ground concentrations up to about 0.1 to 0.15 ppm.
Above the 0.2 ppm threshold is where you should start to be more cautious with how much ozone you are intaking and for how long. Generally 0.2 ppm will have little to no effects on humans, however those with respiratory conditions may be affected. At about 0.3 ppm some plants start to become damaged after exposure. Even prolonged exposure at 0.3 ppm can leave humans with shortness of breath and a headache. These symptoms are usually treated easily with some time in fresh air. At higher concentrations, especially past the 0.5 ppm threshold, you should stay away from the area until the ozone level has gone back down to around 0.1 ppm.
Conclusion
Ozone is a great gas for a huge number of uses, from deodorizing to water treatment to killing viruses and much more. It doesn't leave residue (unlike chemicals,) and it can be incredibly cost-effective in the long run, as it can be made anywhere that oxygen exists. However, as with everything, ozone is best used in moderation. More is not always better, so you should always determine how much ozone is necessary for your needs. Call us at 888-892-0303 or email us at sales@ozonesolutions.com. Ozone Solutions today for help! We can do everything from determining the best equipment for you to engineering a custom built system for your needs!